Red Rock Canyon Weather and Heat Safety
Heat, storms and dry air in the Mojave Desert
Canyon weather compared with Las Vegas
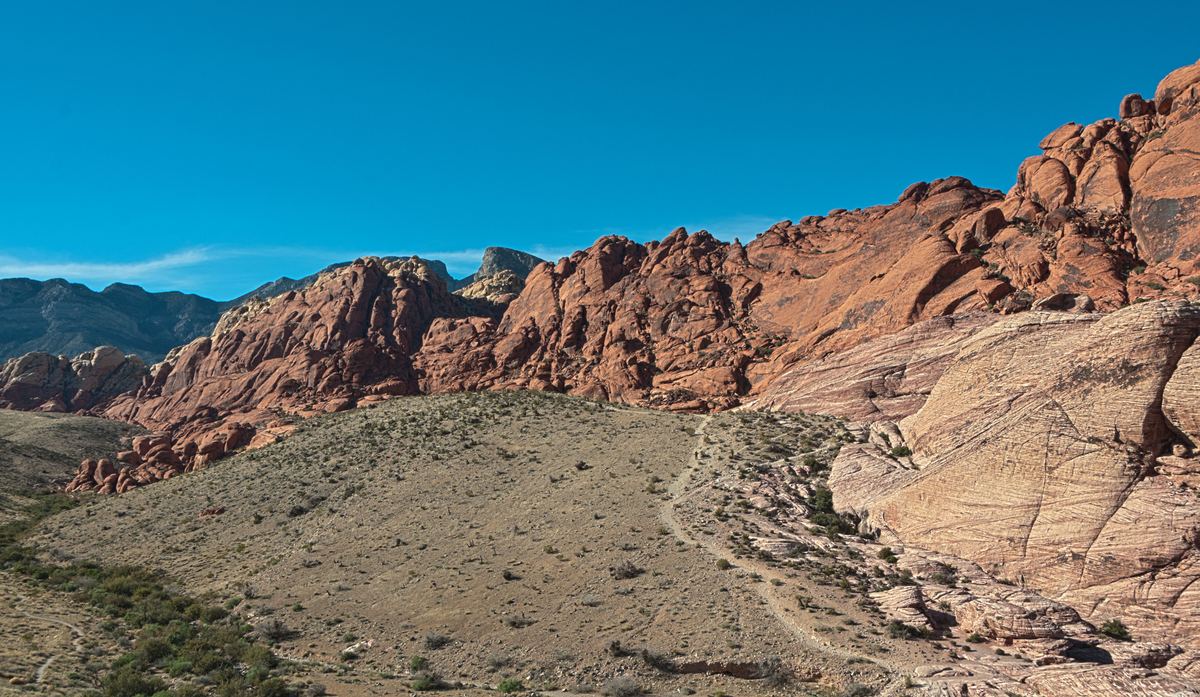
Weather at Red Rock Canyon can be drastically different from Las Vegas, and checking the forecast before coming is part of the guidance for visitors.
Summer highs average over 100°F (38°C) in the Mojave Desert, and summer temperatures regularly exceed 110°F (43°C). Temperatures over 120°F (49°C) have been recorded in the Las Vegas Valley. Pets tolerate hiking in the heat less well than people.
Monthly temperatures in Las Vegas
The figures in this section are Las Vegas, Nevada averages for 1991–2020. The mean daily maximum is 58.5 °F (14.7 °C) in January, 71.1 °F (21.7 °C) in March, 99.4 °F (37.4 °C) in June, 102.8 °F (39.3 °C) in August and 67.1 °F (19.5 °C) in November.
Las Vegas, Nevada, mean daily maximum by month.
| Item | Value (°F) |
|---|---|
| January | 58.5 |
| March | 71.1 |
| June | 99.4 |
| August | 102.8 |
| November | 67.1 |
Daily mean and minimum temperatures
| Month | Measure | Temperature |
|---|---|---|
| January | Daily mean | 49.5 °F (9.7 °C) |
| April | Daily mean | 67.7 °F (19.8 °C) |
| June | Daily mean | 87.6 °F (30.9 °C) |
| September | Daily mean | 83.6 °F (28.7 °C) |
| November | Daily mean | 57.2 °F (14.0 °C) |
| February | Mean daily minimum | 44.1 °F (6.7 °C) |
| April | Mean daily minimum | 56.9 °F (13.8 °C) |
| July | Mean daily minimum | 82.0 °F (27.8 °C) |
| September | Mean daily minimum | 72.4 °F (22.4 °C) |
| December | Mean daily minimum | 39.6 °F (4.2 °C) |
Precipitation in Las Vegas
In the Las Vegas, Nevada averages for 1991–2020, February has 0.80 in (20 mm) of precipitation, May 0.07 in (1.8 mm), July 0.38 in (9.7 mm), October 0.32 in (8.1 mm) and December 0.45 in (11 mm).
| Month | Average precipitation |
|---|---|
| February | 0.80 in (20 mm) |
| May | 0.07 in (1.8 mm) |
| July | 0.38 in (9.7 mm) |
| October | 0.32 in (8.1 mm) |
| December | 0.45 in (11 mm) |
| Month | Average days |
|---|---|
| March | 2.8 days |
| May | 1.1 days |
| August | 2.2 days |
| October | 1.7 days |
Winter and shoulder seasons
Rain, hail and snow flurries may occur in winter, especially in February and March. Weather can be unpredictable, especially in spring and fall, and layered clothing is recommended.
For scale, the Las Vegas mean daily maximum in January is 58.5 °F (14.7 °C), and the mean daily minimum in December is 39.6 °F (4.2 °C). March in Las Vegas averages 2.8 days with at least 0.01 in of precipitation, and February averages 0.80 in (20 mm) of precipitation.
Storms, flash floods and wet sandstone
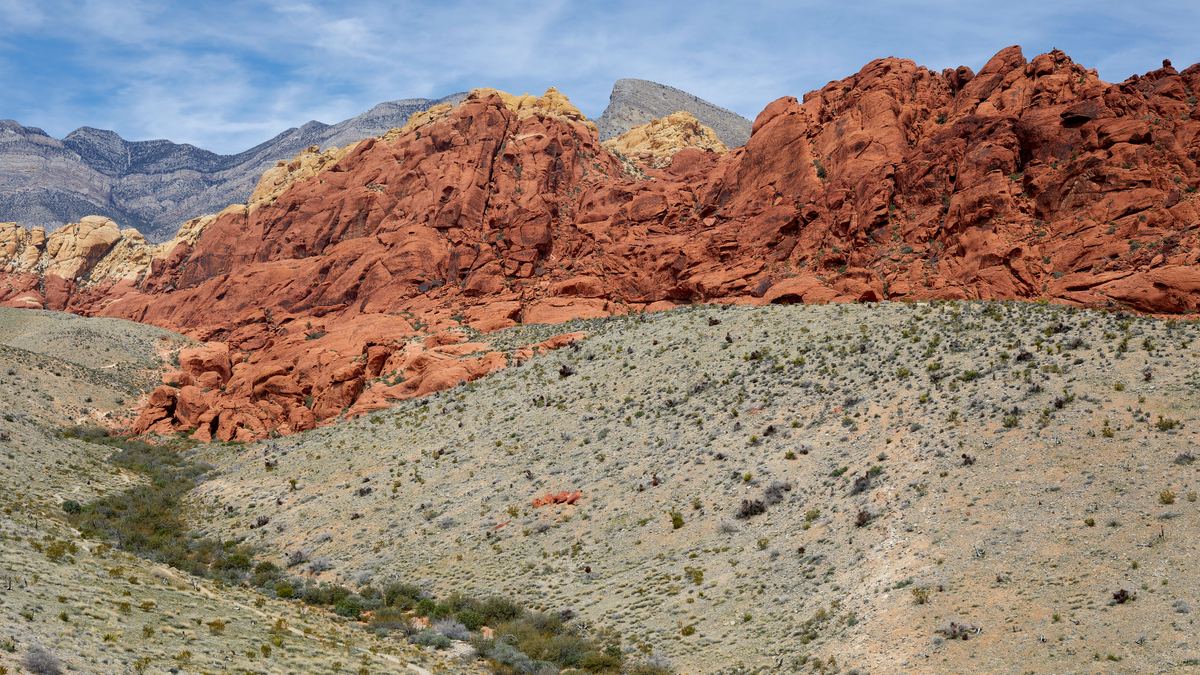
Lightning storms are common in the afternoon during the summer. Flooding occurs more quickly in the desert, and visitors are told to avoid canyons during rainstorms.
Guidance for climbers is a wait of at least 24 or 48 hours after rain before climbing sandstone, with the length depending on how heavy the rain was. In Las Vegas, July averages 0.38 in (9.7 mm) of precipitation and August averages 2.2 days with at least 0.01 in.
Water and dehydration through the year
The Scenic Drive has no potable water, so bottles are filled at the visitor center before leaving. Dehydration is common even in fall and winter, and humidity is low.
Summer highs average over 100°F (38°C) in the Mojave Desert. Rugged dispersed camping is open year-round, while spots are available, on unpaved routes off Lovell Canyon Road near the community of Mountain Springs.
The rock and history behind the landscape
The Keystone Thrust is exposed for 13 miles (21 km) along the Red Rock escarpment. Fault movement pushed older gray rock over younger red rock, creating the varicolored landscape.
Paleo-Indians (Tule Springs) occupied the Red Rock area from about 11,000 to 8000 BC, the earliest culture in the area's chronology. As many as six different Native American cultures may have been present at Red Rock over the millennia. Legislation in 1990 changed the status of the Red Rock Recreation Lands to a National Conservation Area.
Tours
Guided tours and activities
Weather questions
Red Rock Canyon weather FAQ
Is the weather at Red Rock Canyon the same as in Las Vegas?
Weather at Red Rock Canyon can be drastically different from Las Vegas, and checking the forecast before coming is part of the guidance for visitors.
How hot do summers get?
Summer highs average over 100°F (38°C) in the Mojave Desert, and summer temperatures regularly exceed 110°F (43°C). Temperatures over 120°F (49°C) have been recorded in the Las Vegas Valley.
Is there drinking water on the Scenic Drive?
There is no potable water on the Scenic Drive, so bottles are filled at the visitor center before leaving.
Can it rain or snow in winter?
Rain, hail and snow flurries may occur in winter, especially in February and March.
What are the storm risks in summer?
Lightning storms are common in the afternoon during the summer. Flooding occurs more quickly in the desert, and visitors are told to avoid canyons during rainstorms.
How long should climbers wait after rain?
Climbers are advised to wait at least 24 or 48 hours after rain before climbing sandstone, depending on how heavy the rain was.
Is dehydration only a summer concern?
Dehydration is common even in fall and winter, and humidity is low.
Is camping available year-round?
Rugged dispersed camping is open year-round, while spots are available, on unpaved routes off Lovell Canyon Road near the community of Mountain Springs.